Kể từ bây giờ chúng tôi là Elev8
Chúng tôi không chỉ là một nhà môi giới. Chúng tôi là một hệ sinh thái giao dịch tất cả trong một—mọi thứ bạn cần để phân tích, giao dịch và phát triển đều có ở một nơi. Sẵn sàng nâng tầm giao dịch của bạn?
Chúng tôi không chỉ là một nhà môi giới. Chúng tôi là một hệ sinh thái giao dịch tất cả trong một—mọi thứ bạn cần để phân tích, giao dịch và phát triển đều có ở một nơi. Sẵn sàng nâng tầm giao dịch của bạn?
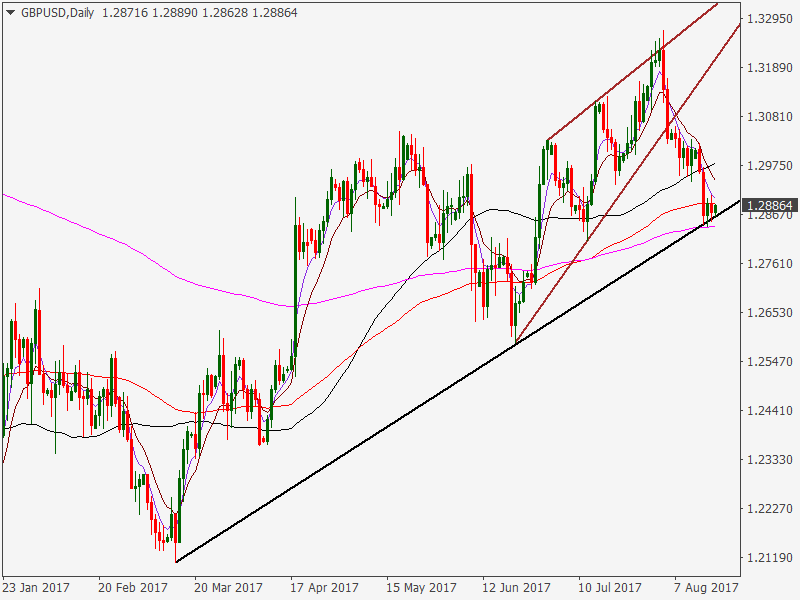
The GBP/USD pair rose to an Intraday high of 1.2909 on Thursday before deflating to 1.2866. The UK July retail sales beat estimates, although the annualised growth was weak. The US-UK 10-year bond yield spread narrowed further to 110 basis points.
Daily chart
US-UK 10-yr yield spread chart
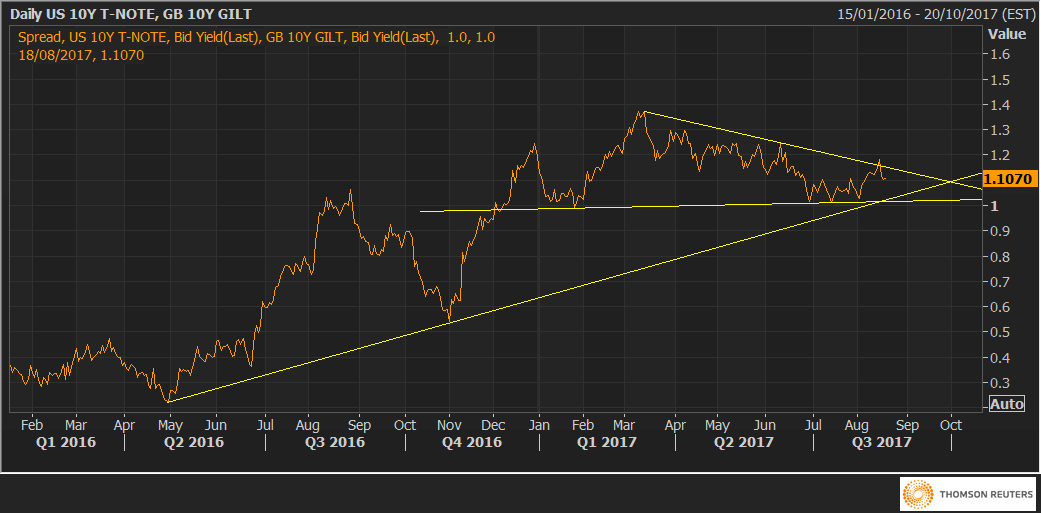
The confluence of the head and shoulders neckline and the trend line sloping higher from Q, 2016 low is seen around 100 basis points.
The spot could see a strong rebound from the rising trend line support if the yield spread breaks below 100 basis points. On the other hand, a spike in the yield spread would strengthen the dollar’s appeal and may yield a big sell-off in the GBP/USD pair.
The data calendar is empty today, hence the yield spread may not move much. Thus, the spot may remain sidelined around the rising trend line support.
GBP/USD Technical Levels
Cable clocked a high of 1.2889. A break above 1.2895 [5-DMA] would open up upside towards 1.2933 [50-DMA] and 1.2949 [10-DMA]. On the downside, breach of support at 1.2863 [rising trend line support] could yield a sell-off to 1.2812 [July 12 low] and 1.2778 [38.2% Fib R of 1.1986-1.3268].