اب سے ہم Elev8 ہیں
ہم صرف ایک بروکر نہیں ہیں۔ ہم ایک جامع ٹریڈنگ ایکوسسٹم ہیں—ہر چیز جو آپ کو تجزیے، ٹریڈ اور ترقی کے لیے درکار ہو، ایک ہی جگہ پر ہے۔ کیا آپ اپنی ٹریڈنگ کو بلند کرنے کے لیے تیار ہیں؟
ہم صرف ایک بروکر نہیں ہیں۔ ہم ایک جامع ٹریڈنگ ایکوسسٹم ہیں—ہر چیز جو آپ کو تجزیے، ٹریڈ اور ترقی کے لیے درکار ہو، ایک ہی جگہ پر ہے۔ کیا آپ اپنی ٹریڈنگ کو بلند کرنے کے لیے تیار ہیں؟
NZD/USD stays mildly bid near 0.6645 while heading into the European session on Friday. The pair recovered from 38.2% Fibonacci retracement of its November-December 2019 upside. Though, a confluence of 21-day SMA and 23.6% Fibonacci retracement restrict the pair’s upside off-late.
With this, bearish MACD gains the market’s attention if prices slip below 38.2% Fibonacci retracement of 0.6590. As a result, December 18 low near 0.6550 could be sellers' favorite ahead of confronting a 200-day SMA level of 0.6515.
Meanwhile, pair’s rise beyond the 0.6655/60 confluence could push it towards 0.6700 and then to December 2019 top surrounding 0.6760.
In a case where the bulls dominate past 0.6760, July 2019 high around 0.6795 could be in focus. Alternatively, the NZD/USD price drop below 0.6515 can recall early-November peak near 0.6465.
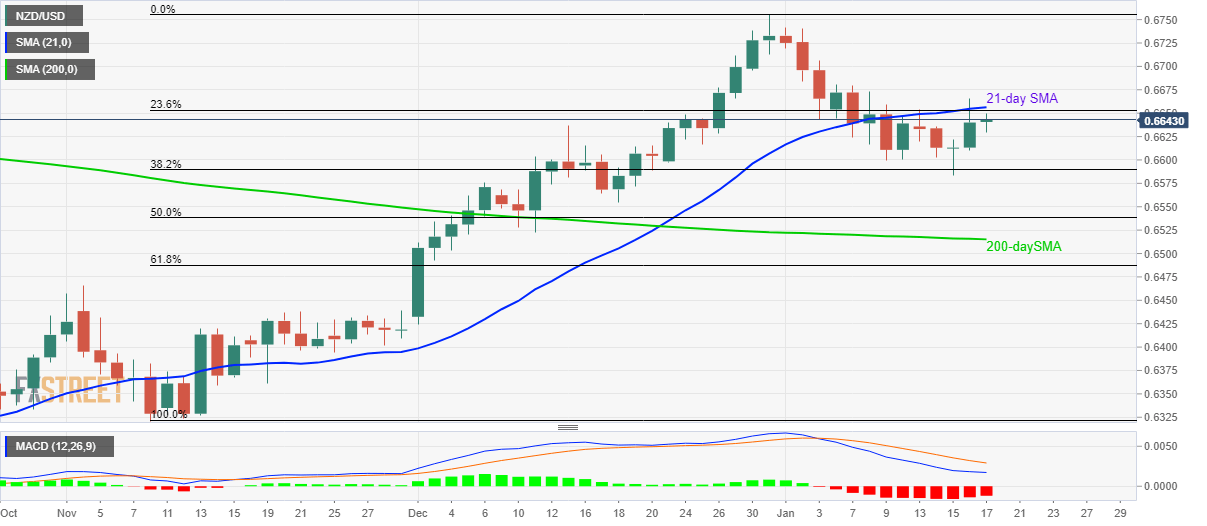
Trend: Pullback expected