এখন থেকে আমরা Elev8
আমরা শুধুমাত্র একটি ব্রোকার নই। আমরা একটি সর্বাত্মক ট্রেডিং ইকোসিস্টেম—বিশ্লেষণ, ট্রেড, এবং প্রবৃদ্ধির জন্য আপনার যা কিছু প্রয়োজন তা এক জায়গায়। আপনার ট্রেডিং উন্নত করতে প্রস্তুত?
আমরা শুধুমাত্র একটি ব্রোকার নই। আমরা একটি সর্বাত্মক ট্রেডিং ইকোসিস্টেম—বিশ্লেষণ, ট্রেড, এবং প্রবৃদ্ধির জন্য আপনার যা কিছু প্রয়োজন তা এক জায়গায়। আপনার ট্রেডিং উন্নত করতে প্রস্তুত?
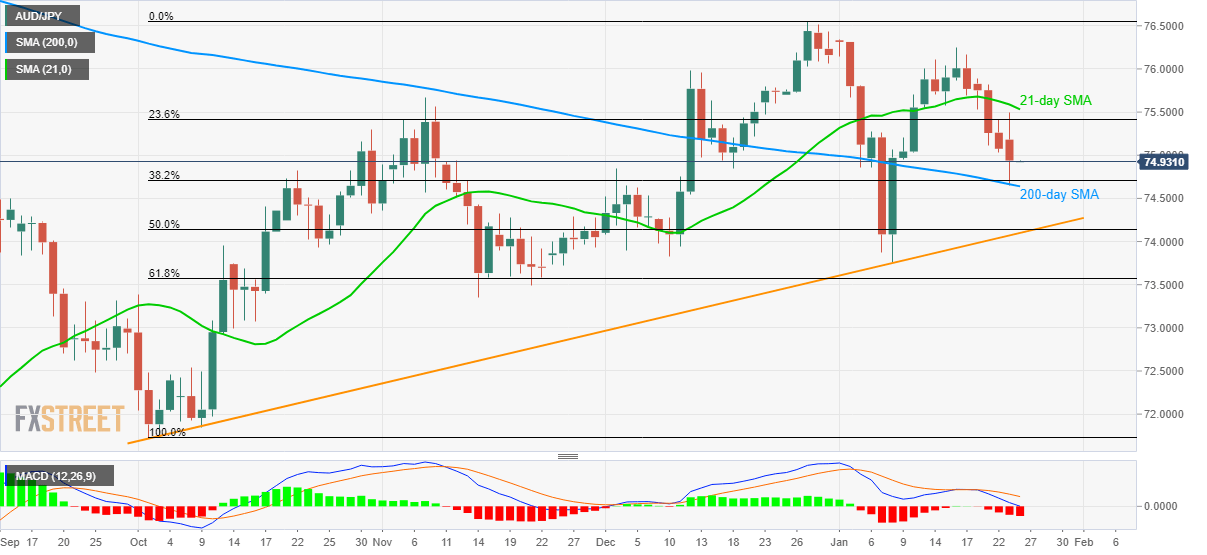
AUD/JPY trades modestly changed to 74.93 at the start of Friday’s Asian session. The pair recently dropped to the lowest in two-weeks but 200-day SMA and 38.2% Fibonacci retracement of its October-December 2019 rise confined further declines.
With this, the quote may witness some pullback towards 75.00 and 23.6% Fibonacci retracement level near 75.40. However, a 21-day SMA level of 75.55 can cap the recovery afterward.
If AUD/JPY prices rally beyond 75.55, the monthly top near 76.30 will be on the bulls’ radar.
Meanwhile, a downside break of 74.70/60 support confluence, comprising 200-day SMA and 38.2% Fibonacci retracement, can drag the pair to a multi-month-old rising support line and 50% Fibonacci retracement, around 74.15/10 now.
In a case where the bears dominate below 74.10, odds of the pair’s revisit to the monthly low near 73.75 can’t be ruled out.
Trend: Pullback expected