अब से हम Elev8 हैं
हम केवल एक ब्रोकर नहीं हैं। हम एक ऑल-इन-वन ट्रेडिंग इकोसिस्टम हैं—आपको विश्लेषण करने, ट्रेड करने और बढ़ने के लिए जो कुछ भी चाहिए, वह एक ही स्थान पर है। क्या आप अपने ट्रेडिंग को ऊँचा उठाने के लिए तैयार हैं?
हम केवल एक ब्रोकर नहीं हैं। हम एक ऑल-इन-वन ट्रेडिंग इकोसिस्टम हैं—आपको विश्लेषण करने, ट्रेड करने और बढ़ने के लिए जो कुछ भी चाहिए, वह एक ही स्थान पर है। क्या आप अपने ट्रेडिंग को ऊँचा उठाने के लिए तैयार हैं?
USD/JPY pulls back from 100-day SM awhile taking the bids to 109.03 during early Tuesday. Following its declines below 61.8% Fibonacci retracement of April-August 2019 fall, the pair dropped to the lowest since January 08, amid bearish MACD, in recent days.
While 61.8% Fibonacci retracement, at 109.52, will act as the support-turned-resistance, 109.80 and 110.00 could entertain buyers ahead of making them confront the upper line of the trend channel stretched from early-October 2019, currently near 110.35.
Alternatively, pair’s declines below 100-day SMA level of 108.70 will be limited by 50% Fibonacci retracement and 200-day SMA, 108.60 and 108.45 respectively.
During the quote’s extended weakness under 108.45, the aforementioned channel’s support line near 107.90 will be the key to watch.
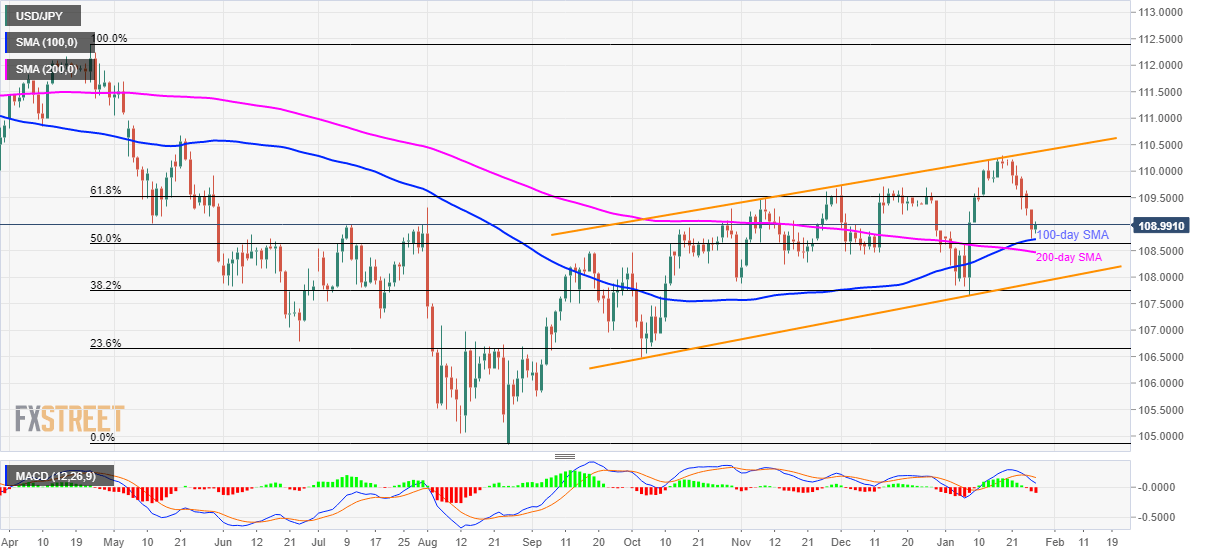
Trend: Pullback expected