اب سے ہم Elev8 ہیں
ہم صرف ایک بروکر نہیں ہیں۔ ہم ایک جامع ٹریڈنگ ایکوسسٹم ہیں—ہر چیز جو آپ کو تجزیے، ٹریڈ اور ترقی کے لیے درکار ہو، ایک ہی جگہ پر ہے۔ کیا آپ اپنی ٹریڈنگ کو بلند کرنے کے لیے تیار ہیں؟
ہم صرف ایک بروکر نہیں ہیں۔ ہم ایک جامع ٹریڈنگ ایکوسسٹم ہیں—ہر چیز جو آپ کو تجزیے، ٹریڈ اور ترقی کے لیے درکار ہو، ایک ہی جگہ پر ہے۔ کیا آپ اپنی ٹریڈنگ کو بلند کرنے کے لیے تیار ہیں؟
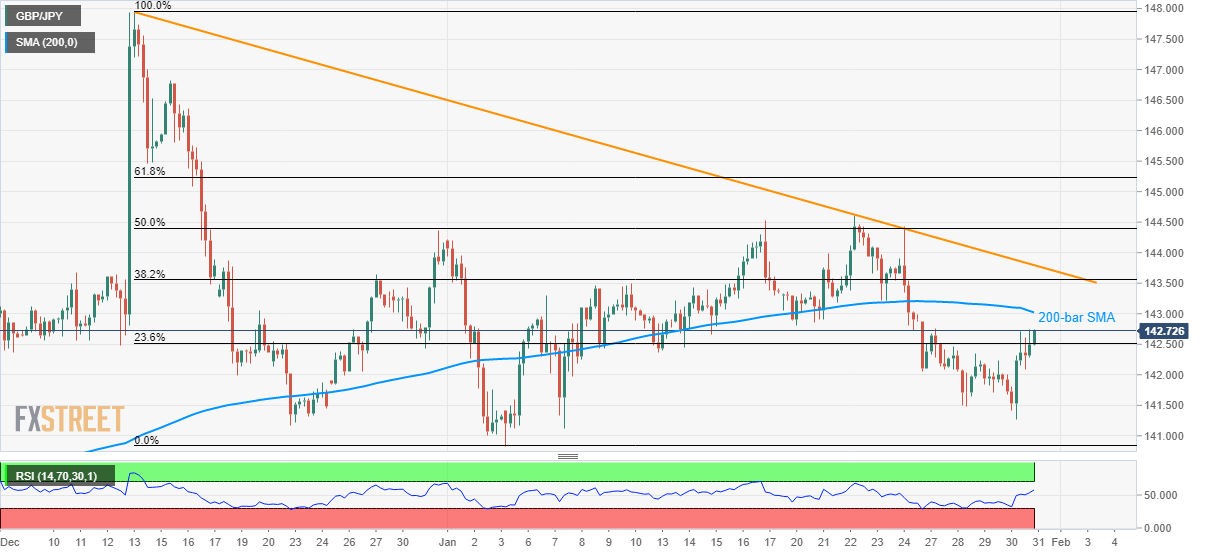
GBP/JPY takes the bids to 142.70 during Friday’s Asian session. The pair recently cleared 23.6% Fibonacci retracement of its fall from December 13 to January 05. Even so, the quote is still below the key upside barriers.
While the recovery in RSI and a sustained break of 23.6% Fibonacci retracement favoring the pair’s run-up, a 200-bar SMA level of 143.00 is likely nearby concern of the buyers.
However, the pair’s further upside will be capped by 38.2% Fibonacci retracement and a falling trend line from December 13, respectively around 143.55 and 143.80.
On the contrary, pair’s declines below 23.6% Fibonacci retracement level of 142.50 can recall 141.70 and the monthly bottom close to 140.80.
During the course of further south-run below 140.80, 140.00 will be important as it holds the key to pair’s drop towards lows marked in November and late-October 2019, around 139.30 and 138.90 respectively.
Trend: Further recovery expected