Kể từ bây giờ chúng tôi là Elev8
Chúng tôi không chỉ là một nhà môi giới. Chúng tôi là một hệ sinh thái giao dịch tất cả trong một—mọi thứ bạn cần để phân tích, giao dịch và phát triển đều có ở một nơi. Sẵn sàng nâng tầm giao dịch của bạn?
Chúng tôi không chỉ là một nhà môi giới. Chúng tôi là một hệ sinh thái giao dịch tất cả trong một—mọi thứ bạn cần để phân tích, giao dịch và phát triển đều có ở một nơi. Sẵn sàng nâng tầm giao dịch của bạn?
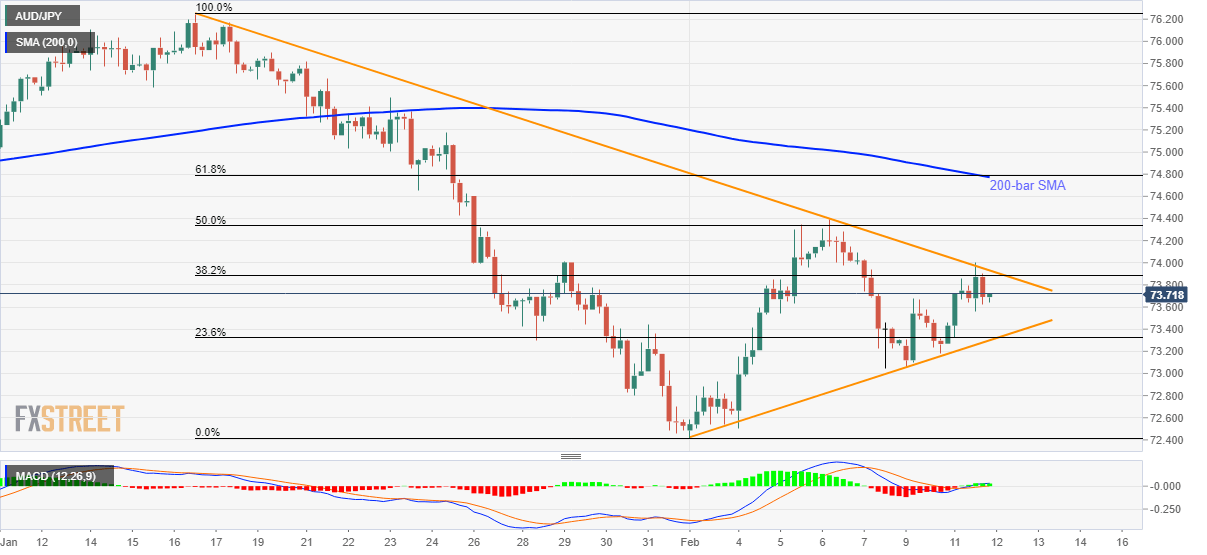
AUD/JPY trades near 73.71 during the early Wednesday morning in Asia. In doing so, the pair remains inside the short-term symmetrical triangle formation. However, bullish MACD signals and a broad risk recovery seem to favor the quote’s further upside.
That said, the triangle’s resistance around 74.00 will be the trigger for the fresh run-up towards the last week’s top surrounding 74.40.
However, a confluence of 200-bar SMA and 61.58% Fibonacci retracement of the pair’s declines between January 16 and February 02, around 74.77/80, will be the key resistance holding the gate for the arrival of 75.00.
On the downside, the triangle support and 23.6% Fibonacci retracement limit the pair’s near-term declines close to 73.30.
Should AUD/JPY prices slip below 73.30, 73.00 and the monthly low around 72.40 will return to the charts.
Trend: Further recovery expected