अब से हम Elev8 हैं
हम केवल एक ब्रोकर नहीं हैं। हम एक ऑल-इन-वन ट्रेडिंग इकोसिस्टम हैं—आपको विश्लेषण करने, ट्रेड करने और बढ़ने के लिए जो कुछ भी चाहिए, वह एक ही स्थान पर है। क्या आप अपने ट्रेडिंग को ऊँचा उठाने के लिए तैयार हैं?
हम केवल एक ब्रोकर नहीं हैं। हम एक ऑल-इन-वन ट्रेडिंग इकोसिस्टम हैं—आपको विश्लेषण करने, ट्रेड करने और बढ़ने के लिए जो कुछ भी चाहिए, वह एक ही स्थान पर है। क्या आप अपने ट्रेडिंग को ऊँचा उठाने के लिए तैयार हैं?
USD/IDR’s daily chart Bollinger Bands – standard deviation of +2/-2 on price’s 20-day moving average – have turned flat for the first time since early December, signaling a neutral bias.
A close above the upper Bollinger Band at 13,757 would confirm a bullish breakout and open the doors for a test of the former support-turned-hurdle of 13,883 (July 19 low).
On the flip side, a breakdown below the lower Bollinger Band, currently at 13,596, would imply a continuation of the sell-off from highs above 14,300 observed in August 2019 and shift risk in favor of a slide to 13,500.
At press time, the pair is trading at 13,695.
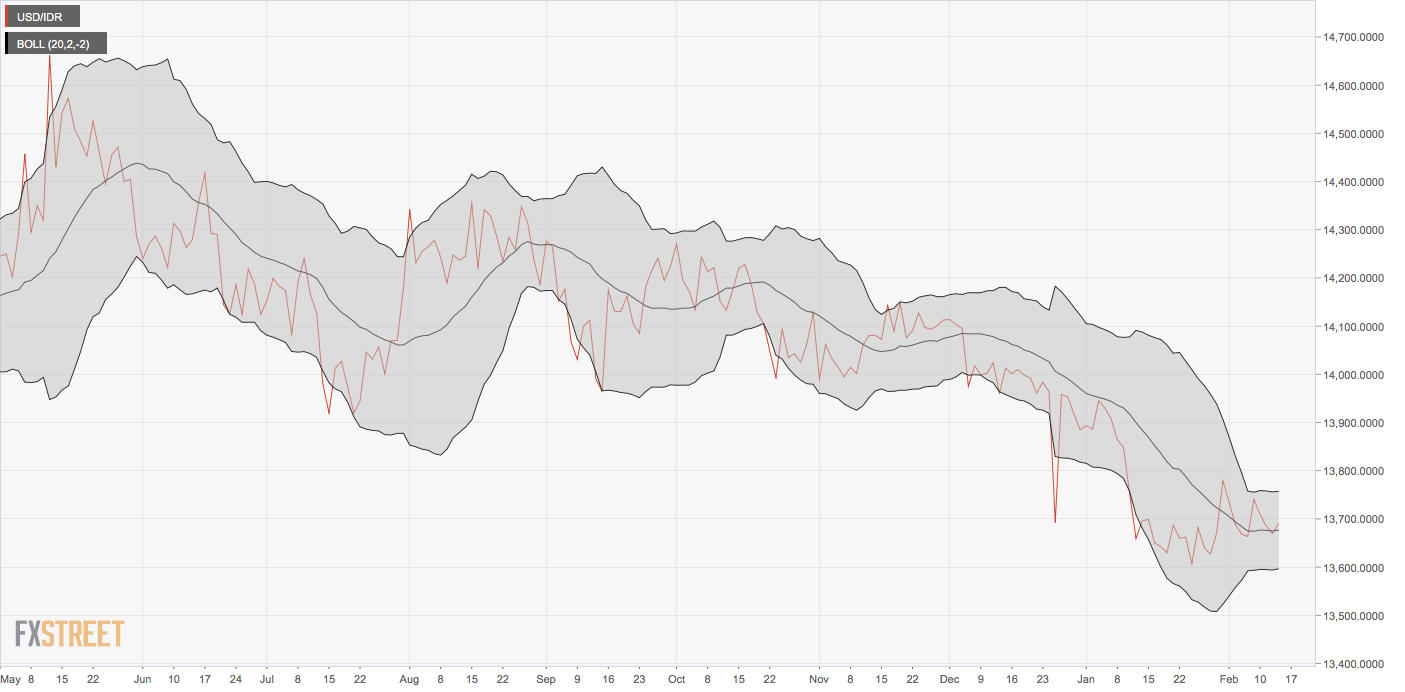
Trend: Neutral