A partir de ahora somos Elev8
Somos más que un simple corredor. Somos un ecosistema de trading todo en uno: todo lo que necesitas para analizar, operar y crecer está en un solo lugar. ¿Listo para elevar tu trading?
Somos más que un simple corredor. Somos un ecosistema de trading todo en uno: todo lo que necesitas para analizar, operar y crecer está en un solo lugar. ¿Listo para elevar tu trading?
USD/INR registers minor gains of around 0.13% while taking the bids to 71.43 amid the initial Indian session on Tuesday. The pair portrays a bearish technical pattern on the daily chart.
With the pair’s repeated failures to take-out 38.2% Fibonacci retracement of its December 11, 2019, to January 08, 2020 upside, odds are high for its gradual declines to 71.22/20 support confluence including 100-day EMA and the bearish formation’ support.
However, the pair’s declines below 71.20 on a daily closing basis will trigger a fresh downside to the yearly bottom surrounding 70.60 and then to December month lows near 70.30.
Meanwhile, an upside clearance of 38.2% Fibonacci retracement, at 71.70, could push the pair towards the 72.00 resistance confluence including the pattern’s resistance and 23.6% Fibonacci retracement.
It’s worth mentioning that the pair’s ability to cross 72.00 defies the downside favoring pattern and will push the quote towards January month top close to 72.60.
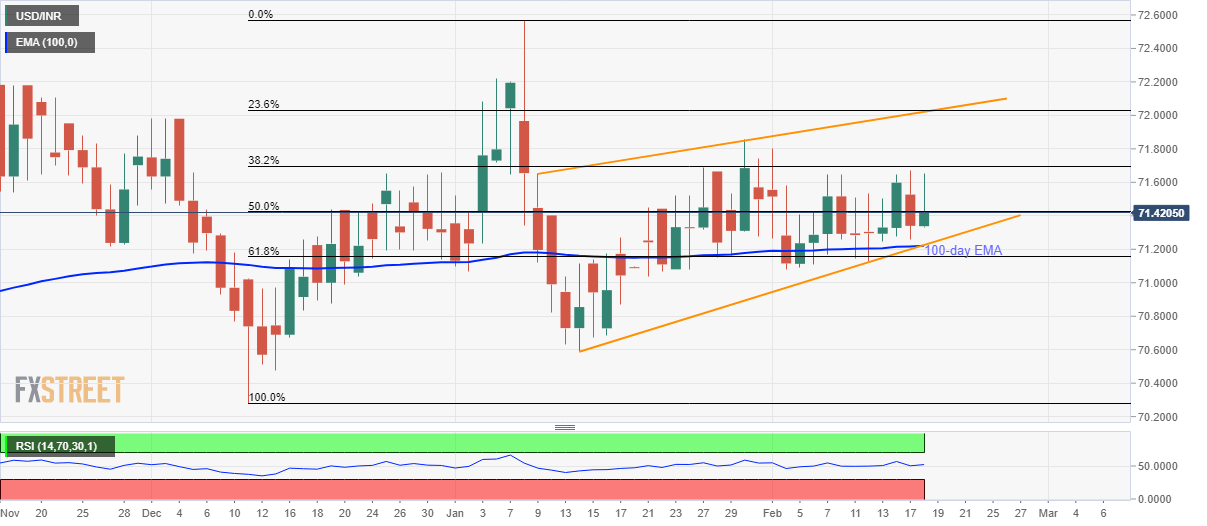
Trend: Pullback expected