এখন থেকে আমরা Elev8
আমরা শুধুমাত্র একটি ব্রোকার নই। আমরা একটি সর্বাত্মক ট্রেডিং ইকোসিস্টেম—বিশ্লেষণ, ট্রেড, এবং প্রবৃদ্ধির জন্য আপনার যা কিছু প্রয়োজন তা এক জায়গায়। আপনার ট্রেডিং উন্নত করতে প্রস্তুত?
আমরা শুধুমাত্র একটি ব্রোকার নই। আমরা একটি সর্বাত্মক ট্রেডিং ইকোসিস্টেম—বিশ্লেষণ, ট্রেড, এবং প্রবৃদ্ধির জন্য আপনার যা কিছু প্রয়োজন তা এক জায়গায়। আপনার ট্রেডিং উন্নত করতে প্রস্তুত?
Gold prices take the bids to $1,586.50, +0.35%, during the pre-European session on Tuesday. The yellow metal recently broke a downward sloping trend line stretched from January 08. Though, the resistance line of the short-term ascending trend channel and the monthly top could restrict the bullion’s further upside.
Should there be a further upside beyond $1,594/95 region, $1,600 could offer an intermediate halt to the run-up towards the yearly top surrounding $1,612.
Meanwhile, the precious metal’s declines below resistance-turn-support and 61.8% Fibonacci retracement, at $1,582, could fetch the quote towards another key support confluence. The same includes the said channel’s lower line and 50% Fibonacci retracement around $1,573/72.
In a case where the bears keep dominating past-$1,572, the return of the $1,545 and the yearly bottom close to $1,536 can’t be ruled out.
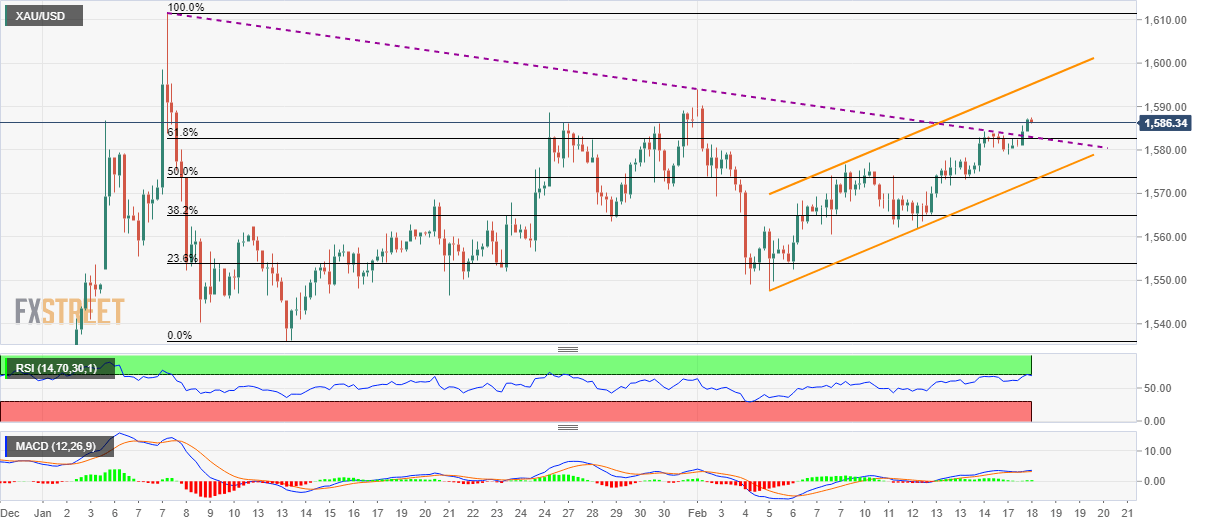
Trend: Bullish