Kể từ bây giờ chúng tôi là Elev8
Chúng tôi không chỉ là một nhà môi giới. Chúng tôi là một hệ sinh thái giao dịch tất cả trong một—mọi thứ bạn cần để phân tích, giao dịch và phát triển đều có ở một nơi. Sẵn sàng nâng tầm giao dịch của bạn?
Chúng tôi không chỉ là một nhà môi giới. Chúng tôi là một hệ sinh thái giao dịch tất cả trong một—mọi thứ bạn cần để phân tích, giao dịch và phát triển đều có ở một nơi. Sẵn sàng nâng tầm giao dịch của bạn?
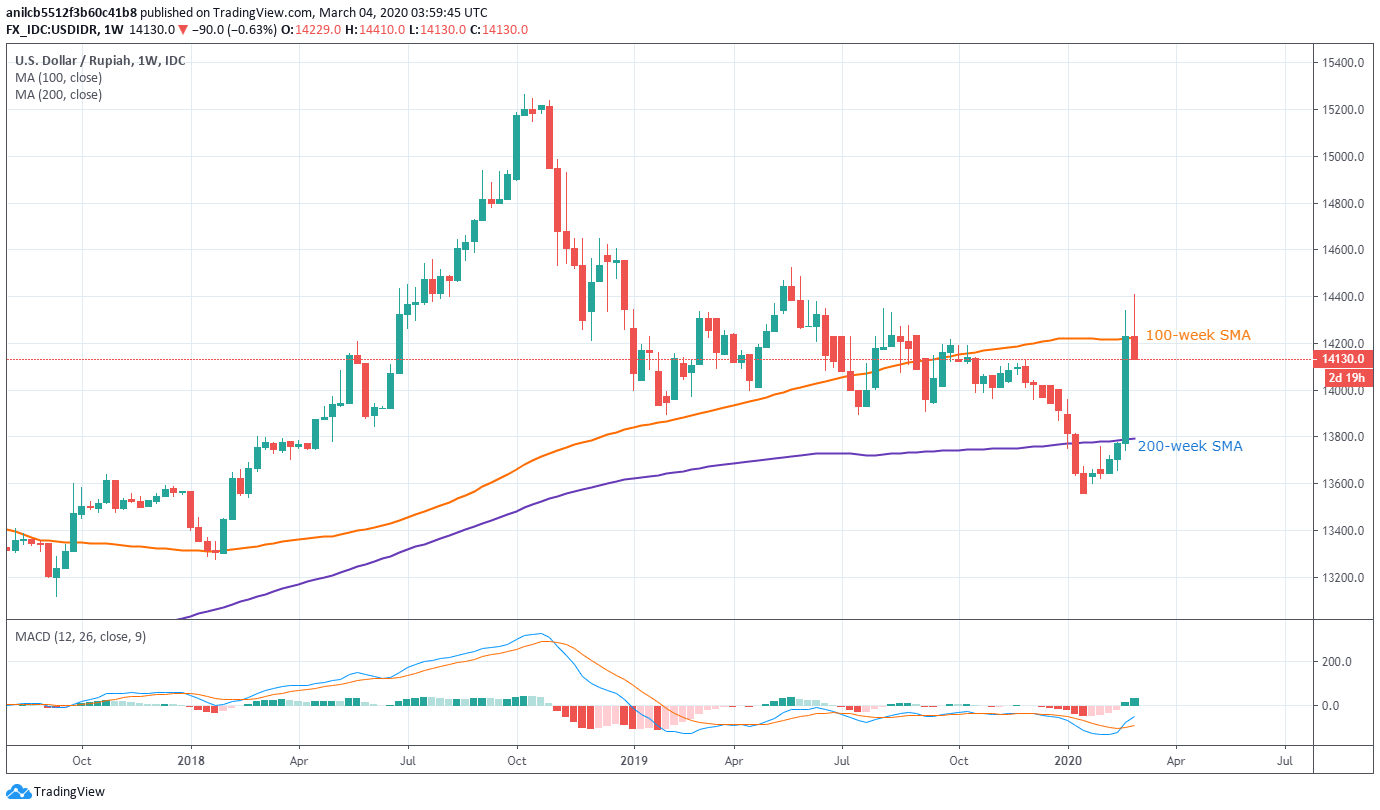
Having failed to cross the May 2019 high, USD/IDR slips below 100-week SMA while declining to 14,130, down 0.47%, during the pre-European session on Wednesday.
The pair now takes rounds to December 2019 peak with 14,000 round-figure acts as the immediate support.
During the quote’s further downside below 14,000, lows marked in February and July 2019, surrounding 13,895, will be the key to watch as a break of which can recall a 200-week SMA level near 13,790.
On the contrary, a sustained break above the 100-week SMA level of 14,226 will enable buyers to again challenge May 2019 peak close to 14,525.
In a case where the bulls manage to dominate past-14,525, multiple highs marked during late-2018 around 14,650 will be on their radars.
Trend: Pullback expected